BUILDING NON-LINEAR ANALYSIS TOOLS FOR C-PAC

Contributing to C-PAC

Multivariate Granger Causality in Python for fMRI Timeseries Analysis

Wiener-Granger causality (“G-causality”) is a statistical notion of causality applicable to time series data, whereby cause precedes, and helps predict, effect. For the purpose of analysing fMRI timeseries, we have developed as a first approach a series of python scripts to calculate the Multivariate Granger Causality (MVGC) based on the MVGC toolbox of Barnett & Seth [1]. The most common operationalisation of G-causality, and the one on which the MVGC Toolbox is based, utilises VAR (vector autoregression) modelling of time series data. But it is not the only one, and our intention is to explore other options too and extend to other options that could be more robust.

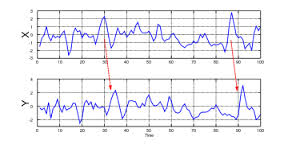
G-causality assumes two jointly distributed vector-valued stochastic processes (“variables”) X = X1 , X2 , …, Y = Y1 , Y2 , …. We say that X does not G-cause Y if and only if Y, conditional on its own past, is independent of the past of X; intuitively, past values of X yield no information about the current value of Y beyond information already contained in the past of Y itself. If, conversely, the past of X does convey information about the future of Y above and beyond all information contained in the past of Y then we say that X G-causes Y, as you can see in the image.
image

The steps to calculate MVGC are the following: We first have to compute the autocovariance matrix from the timeseries. After that, extract the coefficients with the VAR modelling and finally, perform the calculation of the MVGC. More detailed explanations and comments of the code on GitHub and the paper itself. In the following example, X is the timeseries matrix and q is the order of the model (number of lags).

1
2
3
4
5
6
7
8
9
10
11
12
13
14
15
16
17
def tsdata_to_autocov(X, q):

    import numpy as np
    from matplotlib import pylab

    if len(X.shape) == 2:
        X = np.expand_dims(X, axis=2)
        [n, m, N] = np.shape(X)
    else:
        [n, m, N] = np.shape(X)
    X = pylab.demean(X, axis=1)
    G = np.zeros((n, n, (q+1)))

    for k in range(q+1):
        M = N * (m-k)
        G[:,:,k] = np.dot(np.reshape(X[:,k:m,:], (n, M)), np.reshape(X[:,0:m-k,:], (n, M)).conj().T) / M-1
    return G

For the calculation of the MVGC, inputs needed are G (autocovariance sequence), x (vector of indices of target (causee) multi-variable) and y (vector of indices of source (causal) multi-variable). The MVGC calculation, extracts the coefficients with the VAR model of all variables (x, y, z) and then without the source (x,z). The output F is the Granger Causality itself.

1
2
3
4
5
6
7
8
9
10
11
12
13
14
15
16
17
18
19
20
21
22
23
24
25
26
def autocov_to_mvgc(G, x, y):

    import numpy as np
    from mvgc import autocov_to_var
  
    n = G.shape[0]

    z = np.arange(n)
    z = np.delete(z,[np.array(np.hstack((x, y)))])
    # indices of other variables (to condition out)
    xz = np.array(np.hstack((x, z)))
    xzy = np.array(np.hstack((xz, y)))
    F = 0

    # full regression
    ixgrid1 = np.ix_(xzy,xzy)
    [AF,SIG] = autocov_to_var(G[ixgrid1])

    # reduced regression
    ixgrid2 = np.ix_(xz,xz)
    [AF,SIGR] = autocov_to_var(G[ixgrid2])


    ixgrid3 = np.ix_(x,x)
    F = np.log(np.linalg.det(SIGR[ixgrid3]))-np.log(np.linalg.det(SIG[ixgrid3]))
    return F

To calculate the coefficients:

1
2
3
4
5
6
7
8
9
10
11
12
13
14
15
16
17
18
19
20
21
22
23
24
25
26
27
28
29
30
31
32
33
34
35
36
37
38
39
40
41
42
43
44
45
46
47
48
49
50
51
def autocov_to_var(G):

    import numpy as np

    [n,m,q1] = G.shape;
    q = q1 - 1
    qn = q * n
    G0 = G[:,:,0]
    # covariance
    GF = np.reshape(G[:,:,1:], (n, qn)).T
    # backward autocov sequence
    GB = np.reshape(np.transpose(G[:,:,1:], (0, 2, 1)), (qn, n))

    # forward  coefficients
    AF = np.zeros([n, qn])
    # backward coefficients (reversed compared with Whittle's treatment)
    AB = np.zeros([n, qn])

    # initialise recursion
    k = 1 # model order
    r = q-k
    kf = np.arange(k*n)
    # forward  indices
    kb = np.arange(r*n, qn)
    # backward indices
    AF[:,kf] = np.dot(GB[kb,:],np.linalg.inv(G0))
    AB[:,kb] = np.dot(GF[kf,:],np.linalg.inv(G0))

    for k in np.arange(2, q+1):

        DF = GB[(r-1)*n+1:r*n,:] - np.dot(AF[:,kf],GB[kb,:])
        VB = G0 - np.dot(AB[:,kb],GB[kb,:])

        AAF = np.dot(DF,np.linalg.inv(VB)); # DF/VB

        DB = GF[(k-1)*n+1:k*n,:] - np.dot(AB[:,kb],GF[kf,:])
        VF = np.dot(G0-AF[:,kf],GF[kf,:])

        AAB = np.dot(DB,np.linalg.inv(VF)); # DB/VF

        AFPREV = AF[:,kf-1]
        ABPREV = AB[:,kb-1]
        r = q-k
        kf = np.arange(1, (np.dot(k, n))+1)
        kb = np.arange(np.dot(r, n)+1, (qn)+1)
        AF[:,kf-1] = np.array(np.hstack((AFPREV-np.dot(AAF, ABPREV), AAF)))
        AB[:,kb-1] = np.array(np.hstack((AAB, ABPREV-np.dot(AAB, AFPREV))))

    SIG = G0-np.dot(AF, GF)
    AF = np.reshape(AF, (n, n, q))
    return [AF, SIG]

This is a preliminary version of the MVGC, we now need to test and validate in real data over the workflows and see if we can get some interesting results. Also, we have agreed that it would be useful to code the Pairwise Conditional Granger Causality (which was maybe the first step to make, before MVGC).

Analyzing Correlations, Entropies and Causalities on Brain Data

Last week we dealt with some aspects on how to construct the workflows:

  • Develop fully functional ones where to integrate functions. ✓ [Currently, to make transformations with the data generated during the workflow, you have to specifically save it]
1
   np.savetxt(in_file+'_corr.txt', corr_mat)
  • Test and validate in a pilot real data over the workflows and see if we can get some interesting results. ✓ [it has been done using different type of data (filtered, non-filtered…), different measures (corr, pcorr and MI) and, in the case of MI, different bin(states) numbers (see 2nd part of the post)]
  • Implement further synchronization analysis measures. ✓ [partialcorr workflow was studied and added to the package and Entropy Correlation Coefficient was implemented as in [1]. Also, it was studied the lossless dimensional discretization by the use of better optimal discretization, sampled entropies and recurrence statistics.

Testing workflows with real data

I’ve tested the Correlation (corr), Partial Correlation (pcorr) and Mutual Information (MI) with 3 different bin_number: 20, 50 and 100, as a pilot approach, were as proper optimization and framework is being fully developed aside. Workflow was tested throughs a dataset of 29 subjects (196 timepoints*voxel) and a 90 ROI parcellation mask (another mask with more parcellations was used, see below). The data was preprocessed and filtered (no global signal was regressed), and rest of criteria were the standards as in [2]. I’ve printed some graphs to comment on results:

a) Randomly selected one matrix (one subject) of each one of the measures: corr, pcorr and MI20 (MI50 and MI100 were too sparse, see below). Corr and MI captured some structures (most of them in common) and pcorr was not able to. We are going to try to figure out what happened with pcorr and if this is a suitable result for this measure. In the other hand, results were quite robust between subjects, unveiling similar relations between ROIs. See below the mean matrix over subjects.

image

b) Connectivity as unweighted was found by thresholding correlations with 0.7.

image

c) Descriptively, mean values over subjects for MI20, MI50 and MI100. The principal diagonal was set to 0 for visualization purposes, as these values represent the Entropy and are higher that the rest. As can be seen, the reported structures change with the amount of bins chosen. Having a very blurry effect in MI100 and structures better defined in MI20 (more small MI values, but structures better captured). This is mainly because having 100 states for a signal with 196 timepoints, reduces the possibility of repeating a state, thus, the maximum value of the MI increases (approximating the maximum possible Entropy) as the number of bins increases.

image

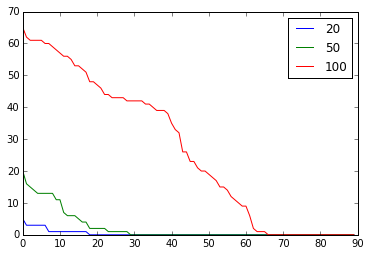
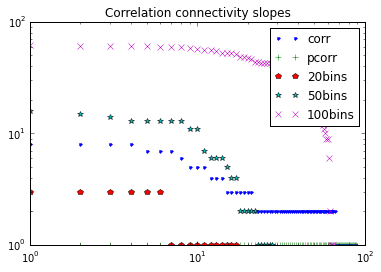
If we superpose again the sorted frequencies in the matrices, using those 3 prospective thresholds, we obtain a similar pattern of also acceptable information lossless discretization. However, the choice of threshold was something more arbitrary that we had not been able to discuss.

image

Theory and discussion

We also progressed in discussion, I’ve a clearer vision of how to implement Multivariate Conditional Granger Causality, based on the one in [3] , implementing “conditional” Granger Causality in multivariate manner [4]. For this purpose, we will program an algorithm that uses the autocovariance sequence and discover whether one of these sequences is reducing the uncertainty of the second (with the mean prediction error), having into account the rest of the series. The order of the model will be likely to be 1, since the TR has a low frequency and the dynamics between the source and the target for order higher would be too separated from each other. The implementation is still in research phase, but I’ve done some experiments with randomly generated series:

1
2
3
4
5
X = np.random.randn(1000)
Y = np.random.randn(1000)

Z = Y.copy();
Z[1:] = Z[1:] + X[0:-1] #so: X influences Z with timelag 1 (order)

And then, as explained here.

With this, we are heading towards a transition from the first to the second box of measures that we were thinking of (the first one more related to preprocessing like filtering, synchronization, basic entropies… and the second one as an analysis module, where we are adding Conditional Granger Causality, Mutual Information, Entropy Correlation Coefficient and many more to come). Anyway, we are not closing the door of the first box, since we have in mind to implement surrogate analysis as in [5] to unveil non-linear phenomena occurring.

Moreover, we were thinking in implementing some kind of preprocessing scripts for frequency-filtering and computing the z-score of the series. Actually, an easy band_pass filter was added to the repo . But then we realised that CPAC already has this functionality implemented, it works fine and there is no point in duplicating it. We will save the bp filter in case we want to use it later on, as we have seen that could be interesting to save some specific bandwidth for some analyses [6]. We will further discuss these options, as we are heading towards frequency and coherence analysis as we see that it will bring us interesting possibilities.

Workflows Working: Correlation and Mutual Information

First of all, I want to anounce that I have enabled comments in the blog, so readers can comment on the entries. Let’s see if this new feature enriches the blog.

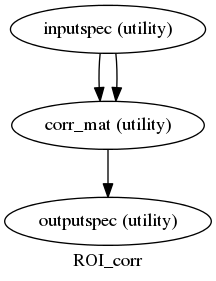
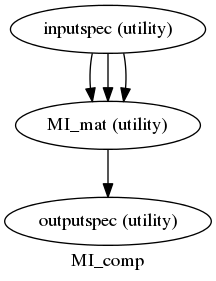
After having some troubles to get them working, we have the first two nipype workflows running. Both are pairwise calculations made over a series of signals selected by the user with a mask:

  • Pairwise Correlation over timeseries given a mask.
  • Pairwise Mutual Information over timeseries given a mask.
1
2
3
4
5
6
7
8
9
def compute_ROI_corr(in_file, mask_file):

    from CPAC.series_mod import gen_roi_timeseries
    from CPAC.series_mod import corr

    ROI_data = gen_roi_timeseries(in_file, mask_file)
    corr_mat = corr(ROI_data)

    return corr_mat
1
2
3
4
5
6
7
8
9
10
11
12
13
14
15
16
17
18
19
20
def compute_MI(in_file, mask_file, bins):

    from CPAC.series_mod import gen_roi_timeseries
    from CPAC.series_mod import transform
    from CPAC.series_mod import mutual_information

    import numpy as np

    ROI_data = gen_roi_timeseries(in_file, mask_file)
    ROI_data = transform(ROI_data,bins).astype(int)

    n_var = ROI_data.shape[0];

    MI_mat = np.zeros((n_var,n_var))

    for i_ in range(n_var):
        for j_ in range(n_var):
            MI_mat[i_,j_] = mutual_information(ROI_data[i_,:],ROI_data[j_,:])

    return MI_mat

image image

In both of them a fMRI file and a mask are needed, and for the MI calculation a variable “bins” is also needed. This variable is the number of states that the user wants the signals to be discretized to.

This brings up a new problem; how many states should we choose to discretize? We are working on this question and discussing whether we should introduce a measure that optimizes the number of bins/states to choose, between other fitting entropy or correlation formalisms. Seems like we could implement some tests to choose a proper “number of states”, we will have a further debate.

The discretization is done with the following helper function:

1
2
3
4
5
6
7
8
9
10
11
12
13
14
15
16
17
18
19
20
21
22
23
24
25
26
27
28
29
30
def transform(x_old, Nbins):

    '''
    TRANSFORM This funcion computes transforms in a matrix
    to obtain a matrix scaled between the especified number of bins
    INPUT:
      x_old: nobservations * nvariables matrix
      Nbins: Number of bins of the transformed matrix (NBins=2 values betwen
     -1, NBins=3 values between 0-2...)

    OUTPUT:  
    x_new: New scaled matrix
    '''

    import numpy as np

    [npoints, num_vals] = x_old.shape
    xmax = Nbins-1
    xmin = 0
    ymax = x_old.max()
    ymin = x_old.min()

    #x_new = ((xmax - xmin)/(ymax - ymin) )* x_old - ( (xmax - xmin) / (ymax - ymin) ) * ymin + xmin;

    x = (xmax-xmin)/(ymax-ymin)
    x_new = x * x_old
    x_new = x_new - (x*ymin+xmin)
    x_new = np.round(x_new)

    return x_new

Also, when testing the workflows, we encountered another problem. While running the scripts by our own with the code alone, we had the results as we were expecting; but, when building and running the workflows, we can not get the results. We need to investigate on this, since is the basis of many things.

To do:

  • Solve the problems with workflows.
  • Try real data over the workflows and see if we can get some interesting results.
  • Implement further synchronization analysis measures.

Coding Has Begun!

Yesterday was the first day of coding of the program, I hope this summer to be a great learning period!

We are now working in a first package of measures that allow us to do a preanalysis of the data and detect non-linear components. We are into measures like Autocorrelation, Entropies (lagged), frequency filtering and many more.

Some problems with memory handling just arose, computing the voxel-wise correlation. We will discuss further how to solve this problem, but we found some solutions [1] [2] to start doing some research about this.

I have added a new partial correlation function developed by Fabian Pedregosa (the author of Scikit-learn), quite more demanding computationally than the simple correlation.

I have improved the readability of the code and removed totally the calls to nitime by using numpy.corrcoef to calculate the correlation over series. Also, I have cleaned the code and the user can choose between doing voxel-wise analysis or ROI-timeseries analysis with two new functions (probably I should name them differently, since CPACs already has functions named like that).

1
2
3
4
5
6
7
8
9
10
11
12
13
14
15
16
17
18
19
20
21
def gen_voxel_timeseries(in_file):
    """
    Extracts voxelwise timeseries and return a np array with them.   
    Parameters
    ----------
    in_file : nifti file
        4D EPI File 
    Returns
    -------
    data_array =  voxel(x,y,z) * timepoints
    """
    import numpy as np
    import nibabel as nb

    img_data = nb.load(in_file).get_data()
    n_samples = img_data.shape[3]
    #print img_data.shape
    (n_x, n_y, n_z, n_t) = img_data.shape
    voxel_data_array = np.reshape(img_data, (n_x*n_y*n_z, n_t), order='F')

return  voxel_data_array
1
2
3
4
5
6
7
8
9
10
11
12
13
14
15
16
17
18
19
20
21
22
23
24
25
26
27
28
29
30
31
32
33
34
35
36
37
38
def gen_roi_timeseries(in_file, mask_file):
    """
    Extracts ROI timeseries and return a np array with them.    

    Parameters
    ----------
    in_file : nifti file
        4D EPI File       
    mask_file : nifti file
        Mask of the EPI File(Only Compute Correlation of voxels in the mask)
        Must be 3D    
    Returns
    -------
    data_array = ROI_number * timepoints
    """
    import numpy as np
    import nibabel as nb

    img_data = nb.load(in_file).get_data()
    n_samples = img_data.shape[3]

    mask_data = nb.load(mask_file).get_data()
    # Cast as rounded-up integer
    mask_data = np.int64(np.ceil(mask_data))

    if mask_data.shape != img_data.shape[:3]:
        raise Exception('Invalid Shape Error.')

    nodes = np.unique(mask_data).tolist()
    nodes.remove(0) #quits the ROI number '0'
    roi_data_array = np.zeros((len(nodes),n_samples))
    nodes.sort()
    for n in nodes:
        node_array = img_data[mask_data == n]
        avg = np.mean(node_array, axis=0)
        roi_data_array[n-1] = np.round(avg, 6)

return  roi_data_array

I have in mind the problem of how to save the data structure (“timeseries * timepoints” or “timepoints * timeseries”). I should ask this in the IRC, an agreement is necessary for building the functions that are going to use this data.

I will finish this week with the Autocorrelation and Partial-Correlation implementation and testing. Coding these along with Transfer Entropy seem a good first week objective while putting into perspective of coding the points raised during discussion, such as:

  • Type and properties of correlations and entropies to calculate (and how these describe the dimensionality of the data and complex patterns).

  • Relation with frequency decomposition and pattern formation, we should extend discussion to Wavelets/Hurst spectrum.

  • Identify useful elements for the fingerprint method (frequency bands).

To do:

  • First objective: work on models of correlation, entropies and ‘discretisation’, as well as their statistical properties (Also as recurrence, etc.)

  • Discuss further the papers from points Cameron made. ECC seems to be a good measure to incorporate to the package.

Notes From the Bonding Period and Discussion: Initial Plan of Implementation

1 - Theoretical discussion:

During the Bonding Period, we have been discussiing some measures more thoroughly, thinking in the possible benefits that C-PAC could obtain of implementing and integrating them into a general toolkit around the ideas of . As a test period we have been working on some approaches and analysis tools.

2 - Collection of measures:

Determination of non-linear components, transient and singularities:

  • Autocorrelation: Is the same approach as Granger Causality, but looking to lagged correlation values instead of coefficients. It gives a fast and reliable information about the series, being analyzed with itself.

  • Entropies and information probabilistic content, partial correlations and sampling formalism (binarizing…)

  • Cross correlation: Pairwise analysis of series looking for a direct correlation between them. The results obtained could be useful to analyze with graph-based methods.

Granger Causality is the term used to measure the ability of predicting the future values of a time series using past values of another time series. Unlike in Information Theory measures, it can be applied to the timeseries directly. We have in mind of developing two methods:

  • Granger Causality Test: This test is a statistical hypothesis test for determining whether one time series is useful in forecasting another, using GC terms.

  • Pairwise GC: This measure excludes the effect of other series in the GC calculation in the multivariate approach. It has a high computational demand.

Some measures to be effective finding connectivity patterns that could be implemented:

  • Avalanches: The importance of this measure relies on the observation that large-scale brain dynamics can be traced as discrete scale-free avalanches. The algorithm has some sub-phases that can be useful too:

    • Point process analysis: Is the first step to avalanche calculation and also could be a good dimensionality reductor for other problems.
    • Clustering and avalanche detection: There are already some clustering algorithms in CPAC that could be reused for this purpose.
  • Multi-fractal analysis, time scaling formalisms…: Fractal processes, like trees or coastlines, are defined by self-similarity or power law scaling controlled by a single exponent, simply related to the box-counting dimension or Hurst exponent of the process. Multifractal processes, like turbulence, have more complex behaviours defined by a spectrum of possible local scaling behaviours or singularity exponents.

  • Fingerprints: A fingerprinting algorithm is a procedure that maps an arbitrarily large data item to a much shorter bit string. We are looking for fMRI suitable fingerprints such IC-fingerprints based on frequency analysis or structural-fingerprints.

3 - Disscussion on implementation:

These measures will be furtherly discussed and how are they implemented will depend largely in the emerging ideas. Anyway, we have an improved timing (plan) for the project which we are translating into the workflow. In term of metrics: We will work each month in some of the blocks mentioned, having the fourth week reserved for testing over large datasets and code refining (efficiency improvements).

image

Moreover, our intention is to keep developing methods for C-PAC after the project period expires, since we are noticing that this can be a good opportunity of both learning and developing new methods.

Information Theory Based Measures and Some Advances

During the bonding period, very interesting discussions came across related to the measures we could develop during the project. As an initial exercise, I thought it could be interesting to test some basic Information Theory based measures. Basically, I wanted to reproduce the calculation of Entropy and the related measures shown in this image:

image

The calculation of the Entropy is quite straightforward, so I decided to test different implementations of some people and test them with the timeit module.

It turned that among 4-5 different functions I found this one coded using numpy and allowing also the calculation of the Joint Entropy using itertools was the fastest by far.

1
2
3
4
5
6
7
8
9
10
def entropy(*X):
    n_insctances = len(X[0])
    H = 0
    for classes in itertools.product(*[set(x) for x in X]):
        v = np.array([True] * n_insctances)
        for predictions, c in zip(X, classes):
            v = np.logical_and(v, predictions == c)
        p = np.mean(v)
        H += -p * np.log2(p) if p > 0 else 0
    return H

Having the basic blocks, I built the Conditional Entropy and Mutual Information easily:

1
2
3
4
5
6
7
8
9
10
11
12
13
14
15
16
def mutual_information(X,Y):

    Hx = entropy(X)
    Hy = entropy(Y)
    Hxy = entropy(X,Y)
    MI = Hx + Hy - Hxy

    return MI

def cond_entropy(X,Y):

    Hy = entropy(Y)
    Hyx = entropy(Y,X)
    CE = Hyx - Hy

    return CE

I proved the functions over small vectors and all the properties seemed to work well. In the other hand, I sorted out the loading of the fMRI files (that I was loading with an external function) and the calculation of the TR using just the NIFTI header using nibabel.

The first time trying to calculate the Entropy voxel-wise (it took like 5 mins and used only 1 core, so this must be solved in some way or another) and over 90 timeseries extracted from a ROI-mask, I failed. As these measures are calculated over probability density functions, the data must be converted into ‘states’, binarized for example. This is another problem I have to solve: Dealing with fMRI datatypes and FSL functions. I still don’t know how to make use directly of FSL utils (and neither about the different FSL options I have. This is a TO DO for my list).

To solve the problem, I’ve created my own timeseries extractor (generates a Numpy array, not a CSV file as in gen_roi_timeseries.py):

1
2
3
4
5
6
7
8
9
10
11
12
13
14
15
16
17
18
    unit_data = nb.load(mask_file).get_data()
    datafile = nb.load(in_file)
    img_data = datafile.get_data()
    n_samples = img_data.shape[3]

    if unit_data.shape != img_data.shape[:3]:
        raise Exception('FAIL')

    nodes = np.unique(unit_data).tolist()
    roi_data = np.zeros((len(nodes)-1,n_samples))

    # Be carefull with number of ROIs and np-arrays
    nodes.sort()
    for n in nodes:
        if n > 0:
            node_array = img_data[unit_data == n]
            avg = np.mean(node_array, axis=0)
            roi_data[n-1] = np.round(avg, 6)

This structure can be used to extract all voxels timeseries as well. As work for the next week, this data has to be binarized to two (or more) ‘states’ and then passed to the IT functions.

First Scripts for C-PAC: This Is Just the Beginning

In this blog I will write about my experience with C-PAC development. Our intention here is to develop a series of scripts that allow us (C-PAC users) to calculate some measures over non-linear fMRI timeseries and integrate them in a workflow. Our aim is to extend and improve C-PAC’s features.

In this first post I will try to explain some of what I have done for my first two scripts for C-PAC as my first contact with C-PAC. I would like to learn a lot about C-PAC’s structure, workflows etc. and give back too. The goal of this first scripts is to say ‘hi’, have some feedback from main developers and take a first hands-on with the code.

In order to learn from C-PAC’s repo on on GitHub and to C-PAC’s forums and I saw a question on cross correlations and though it could be a good exercise to try possibilities (out of using other available utils like FSLcc) and afterwards, I also made the calculation for Transfer Entropy (TE) Granger Causality (GC)). As a short description, these 2 scripts calculate correlations and GC between ROI-time series extracted from an fMRI file (this is done using a ROI-mask with the gen_roi_timeserier.py function which is already in C-PAC).

My code is in the copy I forked, in a new branch called series_mod. I saved my scripts in a folder of the same name.

We have got here 3 files, init _ .py, series_mod.py and utils.py_ . I used these three files from a template of other toolbox in C-PAC. series_mod.py generates the workflows:

1
2
3
4
5
6
7
8
9
10
11
12
13
14
15
16
17
18
19
20
21
22
23
24
25
26
27
def create_corr():
    corr = pe.Workflow(name='corr')
    inputNode = pe.Node(util.IdentityInterface(fields=[
                                                'in_file',
                                                'mask',
                                                'TR'
                                                ]),
                        name='inputspec')

    outputNode = pe.Node(util.IdentityInterface(fields=[
                                                    'corr_mat']),
                        name='outputspec')

    corr_mat = pe.Node(util.Function(input_names=['in_file', 'mask','TR'],
                                   output_names=['out_file'],
                     function=compute_corr),
                     name='corr_mat')

    corr.connect(inputNode, 'in_file',
                    corr_mat, 'in_file')
    corr.connect(inputNode, 'mask',
                    corr_mat, 'mask')
    corr.connect(inputNode, 'TR',
                    corr_mat, 'TR')
    corr.connect(corr_mat, 'out_file',
                 outputNode, 'corr_mat')
    return corr

There are 3 input parameters; fMRI series, the ROI-mask and TR of the fMRI. This function makes use of the functions in utils.py. Let’s see part of the code (present in my repo):

1
2
3
4
5
6
7
8
9
10
11
12
13
14
15
16
17
18
19
20
21
22
23
24
25
26
27
28
29
30
31
32
33
34
35
36
37
38
39
40
41
42
43
44
45
46
def compute_corr(in_file, mask_file, TR):

    """
    Computes the Network Correlation Matrix for ROIs in the mask
    """

    import numpy as np
    from matplotlib.mlab import csv2rec
    from cpac.timeseries import gen_roi_timeseries

    #Import the time-series objects:
    from nitime.timeseries import TimeSeries
    #Import the analysis objects:
    from nitime.analysis import CorrelationAnalyzer
    #Import utility functions:
    from nitime.utils import percent_change

    output_type = [True,False] #list of boolean for csv and npz file formats

    data = gen_roi_timeseries(in_file, mask_file, output_type)
    #from this files gen_roi_timeseries
    #once we have the time series:
    data_rec = csv2rec(data[2])

    #Extract information:
    roi_names = np.array(data_rec.dtype.names)
    n_samples = data_rec.shape[0]

    #Make an empty container for the data
    data = np.zeros((len(roi_names), n_samples))

    for n_idx, roi in enumerate(roi_names):
        data[n_idx] = data_rec[roi]

    #Normalize the data:
    data = percent_change(data)

    T = TimeSeries(data, sampling_interval=TR)
    T.metadata['roi'] = roi_names
    #Initialize the correlation analyzer
    C = CorrelationAnalyzer(T)

    ## IN CASE WE WOULD LIKE TO ADD A THRESHOLD FEATURE (set inside the function
    # or from input)
    # C.corrcoef[C.corrcoef<0.7] = 0
    return  C.corrcoef

It is a trivial computation after extracting the time-series. This data could have been treated or filtered, but this first scripts were just to train myself with the repo, python, nypipe workflows etc. .

I started from my own implementations in python, but also took some of this code and ideas from these tutorials:

[1] http://nipy.org/nitime/examples/resting_state_fmri.html

[2] http://nipy.org/nitime/examples/granger_fmri.html

The result for the correlation when making calculations on preprocessed data of 3mm voxel-size and a mask of 90 ROIs parcellation is

image

I will discuss about the measures we are going to work on in the next post.