As planned in the previous week, an extensive code reviewing and commenting has been carried out during this last week of coding. Major objectives in this code revision were to fix small bugs, to have a common standard for function’s headers, to have commented the main aspects of the functions and to make a full cleaning of the code (with the aim of being as much readable as possible). Many lines of code have been added as explanation of the measures and this was helpful also for the documentation work that we have started in collaboration with John.
It is also important to make comments with regard to possibilities that the developed tools have for future uses (combinations of measures, links to other modules…), or outputs relevant to the technique. To this aspect we have both put our hands on. This is also being added as documentation inside the scripts, as well as some easy procedures to make figures as the ones showed in this blog.
Moreover, some linker function calls have been inserted (e.g. the ones to make the calls to GC module and a full new workflow dedicated to criticality, since this was the one with different data input). With regard to GC module, as we had some strange behaviour on a transformation, we have contacted the developers of the MVGC toolbox and we are involved in discussion with Dr. L. Barnett regard to this issue, engaging well on what it could be a helping hand. We will keep working on this during next week.
Running experiments in the cluster
Further, this week it’s been really fruitful from the point of view of the data analysis. We have been able to build scripts to make our tests run @IFISC cluster, so we can make use of parallelization to calculate our measures over large datasets. To make a first approach, we have been able to compute the whole clustering (1 and 2 neighbours approach) + the avalanche detection for a dataset of 139 subjects in less than 30 mins (it was an average of 20 mins for each subject in my own PC). This will allow us to make extensive data analyzing with the measures and discuss and note parameters as we do document and consider the impact of measures and their preeminence.
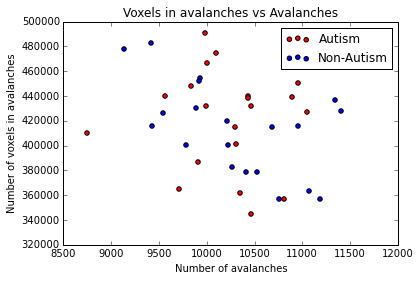
As example, here we show a small analysis between 2 groups of 21 subjects (autism and non-autism patients). The number of avalanches and the number of voxels belonging to an avalanche calculated after 2 neighbour clustering have been studied:

Means over groups and the ratio voxel_number per avalanche were also calculated over groups and differences were neither appreciate. More analyses had to be done, like computing the average lifetime of an avalanche and the avalanche-wise size.
Last week’s objectives
Our objectives for the last week are:
Make last corrections and finalize documentation work as far as possible. In this task, we are going through the code to make insertions that would describe links between measures, graphics of interests, etc
Evaluate the work done. Achievements / Fails as to create a little memorandum for the delivery, and possible lines for collaboration
Pack the code and submit, in agreement with John and hoping to get impressions too
Close project, open future: Make the toolbox more fruitful and better suited. Keep a line of communication for helping on further developments and distend chat about future ideas, and thank so much the team for accommodating us!